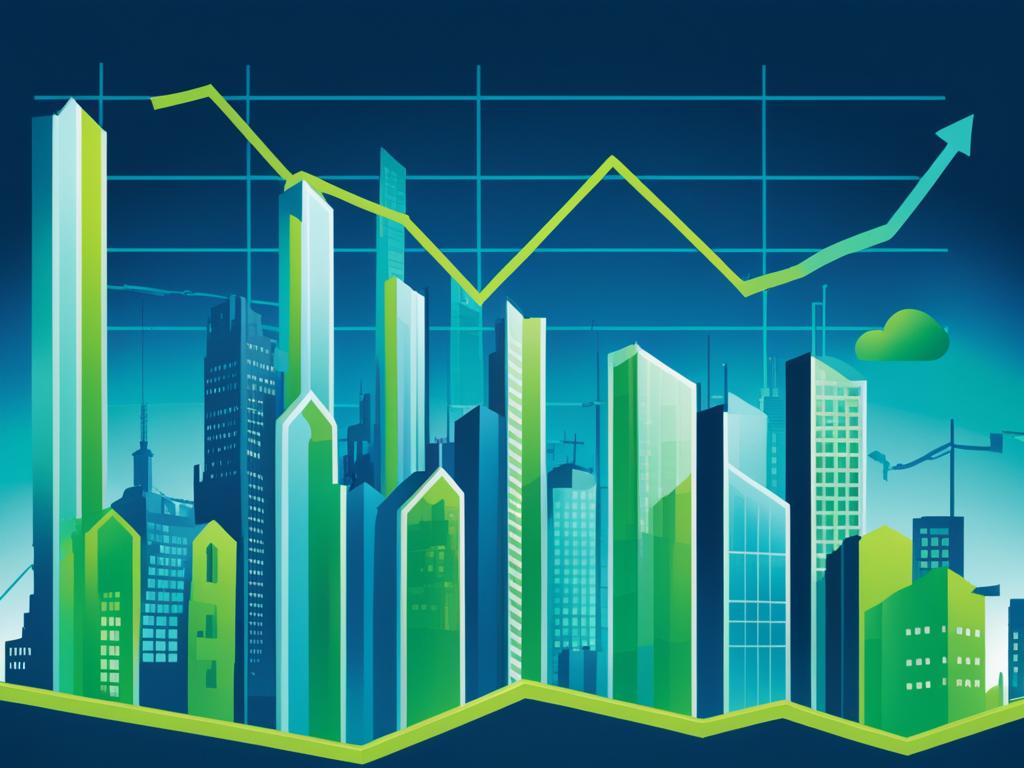
The Analysis of Economic Indicators
In today’s fast-changing economy, understanding key economic indicators is crucial. It helps policymakers, investors, and businesses see how well an economy is doing. These indicators show us market trends, what consumers are doing, and the economy’s overall health. This knowledge is key for making smart decisions and creating effective policies.
This article will look into why economic indicators matter. We’ll see how they help in making choices, what types they are, and how to understand them. We’ll cover everything from GDP growth to unemployment and inflation rates. These are the main factors that shape our economy.
By getting to know economic indicators well, we can handle the global economy’s challenges better. We’ll explore the details of these indicators together. Let’s dive into the data to find the insights that can lead to growth and success.
Understanding the Significance of Economic Indicators
Economic indicators are key tools that show us the state and future of an economy. They help policymakers, businesses, and investors make smart choices. These choices can greatly affect the economy.
Role of Economic Indicators in Decision Making
Economic indicators help stakeholders see how an economy is doing. Governments use them to make policy decisions, like changing interest rates or tackling job and price issues. Businesses look at these indicators to understand market trends and plan their strategies. Investors use them to spot good investment chances and manage risks.
Key Categories of Economic Indicators
Economic indicators fall into three main groups:
- Leading indicators – These give early hints about future economic trends. They include things like consumer confidence, new home starts, and stock market actions.
- Lagging indicators – These show what happened in the economy before, like job rates, GDP growth, and inflation.
- Coincident indicators – These match the current economic state, covering things like industrial output, personal income, and retail sales.
Knowing about these economic indicator types helps decision-makers get a full view of the economy. This way, they can make choices that help the economy grow and stay stable over time.
Gross Domestic Product (GDP) Growth Rate
The Gross Domestic Product (GDP) growth rate shows how much the total value of goods and services changes in a country over time. It’s key to understanding a country’s economic health and its growth. This helps us see how strong and moving in the right direction the economy is.
A positive growth rate means the economy is growing. A negative rate means it’s shrinking. The size of the growth rate tells us how strong the growth is. A bigger rate means a stronger growth.
Looking at the GDP growth rate helps people in charge, businesses, and investors. They can see the economic conditions, make smart choices, and predict what’s coming. By watching the GDP growth rate, they can adjust their plans to fit the economic changes.
The GDP growth rate is just one way to check on a country’s economy. Other things like unemployment, inflation, and trade balances are also important. But the GDP growth rate is a key metric that shows how a country’s economy is doing overall.
In short, the Gross Domestic Product (GDP) growth rate is a key economic indicator. It tracks the change in the total value of goods and services in a country. By keeping an eye on it, people in charge, businesses, and investors can understand the economy’s health and make better decisions.
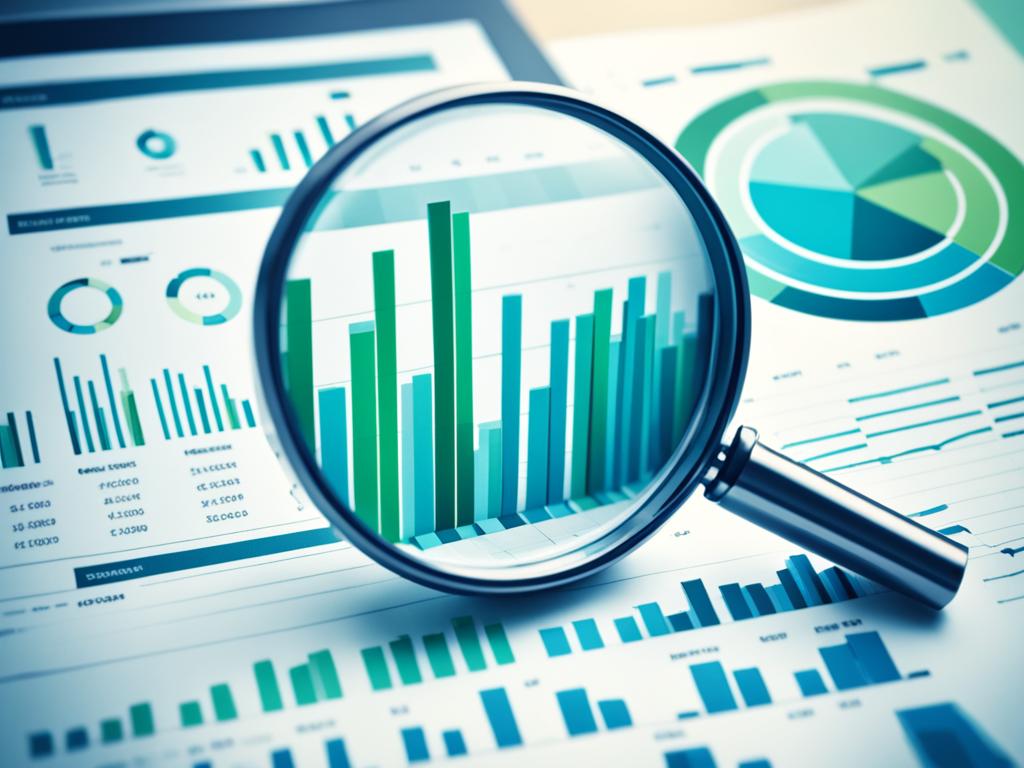
Analysis of Economic Indicators
Looking into economic indicators is key to understanding the economy’s health. We focus on the unemployment rate and labor market trends. We also look at the inflation rate and Consumer Price Index (CPI).
Unemployment Rate and Labor Market Trends
The unemployment rate shows how many people are looking for work but can’t find it. It’s a key way to see how strong the job market is. By watching this rate, experts can make better decisions for jobs and growth.
Labor market trends give us more details on jobs. They include things like new jobs, people working, and what kind of jobs are available. These trends help us understand the job market better, giving us a clearer picture of the economy.
Inflation Rate and Consumer Price Index
The inflation rate tells us how fast prices are going up over time. It’s based on the Consumer Price Index (CPI), which watches the cost of things people buy. Keeping an eye on inflation and CPI helps us see how much money people can buy and the cost of living. It also helps with decisions on money policy.
| Indicator | Description | Significance |
|---|---|---|
| Unemployment Rate | The percentage of the labor force that is actively seeking employment but unable to find a job. | Reflects the strength and stability of the labor market, providing insights into the overall employment landscape. |
| Labor Market Trends | Factors such as job creation, labor force participation, and the types of jobs being filled. | Provides a more comprehensive understanding of the employment situation and the dynamics within the labor market. |
| Inflation Rate | The rate at which the general price level of goods and services in an economy increases over time, typically expressed as a percentage change in the Consumer Price Index (CPI). | Measures the purchasing power of consumers and the overall cost of living, informing monetary policy decisions. |
| Consumer Price Index (CPI) | An index that tracks the changes in the cost of a basket of consumer goods and services. | Provides a measure of inflation and the overall cost of living, allowing for the assessment of the purchasing power of consumers. |
By watching the unemployment rate, labor market trends, inflation rate, and Consumer Price Index, experts can understand the economy well. They can make smart decisions to help the economy grow and improve people’s lives.
Evaluating Financial and Trade Indicators
Looking beyond traditional economic signs, we see the importance of financial and trade metrics. These include the consumer confidence index and the trade balance. They tell us about how people feel, what they spend, and the health of global trade and production.
Consumer Confidence Index and Sentiment Analysis
The consumer confidence index measures how hopeful people are about the economy and their finances. It helps experts and leaders understand how people might spend and what might change in the market.
Sentiment analysis goes deeper, looking at feelings and thoughts that guide what people do. By studying social media and news, researchers spot trends in how people feel and how it affects their choices.
The consumer confidence index and sentiment analysis together give a full picture of the economy. They help businesses and leaders make smart choices that meet what consumers want and expect.
The trade balance and industrial production data also shed light on global trade and manufacturing health. By keeping an eye on these, analysts can grasp global commerce better and spot new chances or issues.
In summary, knowing about financial and trade indicators, along with understanding consumer feelings, is key. It helps in making smart decisions and dealing with the complex economy.
Conclusion
Understanding the economic health and market trends is key. By looking at important metrics, people in charge, businesses, and investors can make better choices. This helps them deal with the economic landscape’s challenges.
Looking at GDP growth, unemployment, inflation, consumer confidence, and trade data gives us insights. This helps us see how the economy is doing overall. It lets people plan for the future, spot new chances, and work towards lasting economic growth.
Studying economic indicators is a strong way to check how an economy is doing and where it’s headed. It helps leaders make smart moves for the economy’s long-term success. As the economy changes, the need to understand these indicators will grow. This shows how crucial it is for making sense of today’s economic world.
FAQ
What is the role of economic indicators in decision-making?
Economic indicators are key for making smart choices. They give insights into the economy’s current state and future. This helps with policy, investment, and business planning.
What are the key categories of economic indicators?
There are three main types of economic indicators. Leading indicators, like the consumer confidence index, hint at future trends. Lagging indicators, such as the unemployment rate, show past trends. Coincident indicators, like GDP growth, show the economy’s current state.
How can the GDP growth rate be interpreted?
The GDP growth rate measures the change in goods and services produced in a country. It shows if the economy is growing or shrinking. This is a key indicator of economic health.
What does the unemployment rate tell us about the labor market?
The unemployment rate shows the percentage of people looking for work. It tells us about the job market’s strength and the economy’s health.
How does the inflation rate and Consumer Price Index (CPI) impact the economy?
Inflation and the CPI measure price changes and purchasing power. They track the cost of goods and services over time. Policymakers watch these closely, as they affect interest rates and policy.
What can the Consumer Confidence Index and trade balance tell us about the economy?
The Consumer Confidence Index reflects how people feel about spending. The trade balance shows the strength of international trade and production. These indicators help understand the economy’s health and performance.


Nice article about economics. How the three main types of economic indicators, it’s roles in the economy